
A new iPhone every year. Or a tiny piece of the company that makes it. What would the second choice be worth now?
In 2007, a new kind of phone arrived. People queued for it, took it home and started tapping at the screen. Meanwhile, Apple shares sat there, available to buy too.
Here's the slightly mischievous question: what if, whenever you felt that familiar new-iPhone itch, you bought Apple stock instead?
We ran a deliberately simple experiment: invest US$799 once a year from 2007 through 2025, using Apple's year-end share prices, and see what that investment would be worth on 19 October 2026. That's 19 deposits, not a lucky one-off purchase.
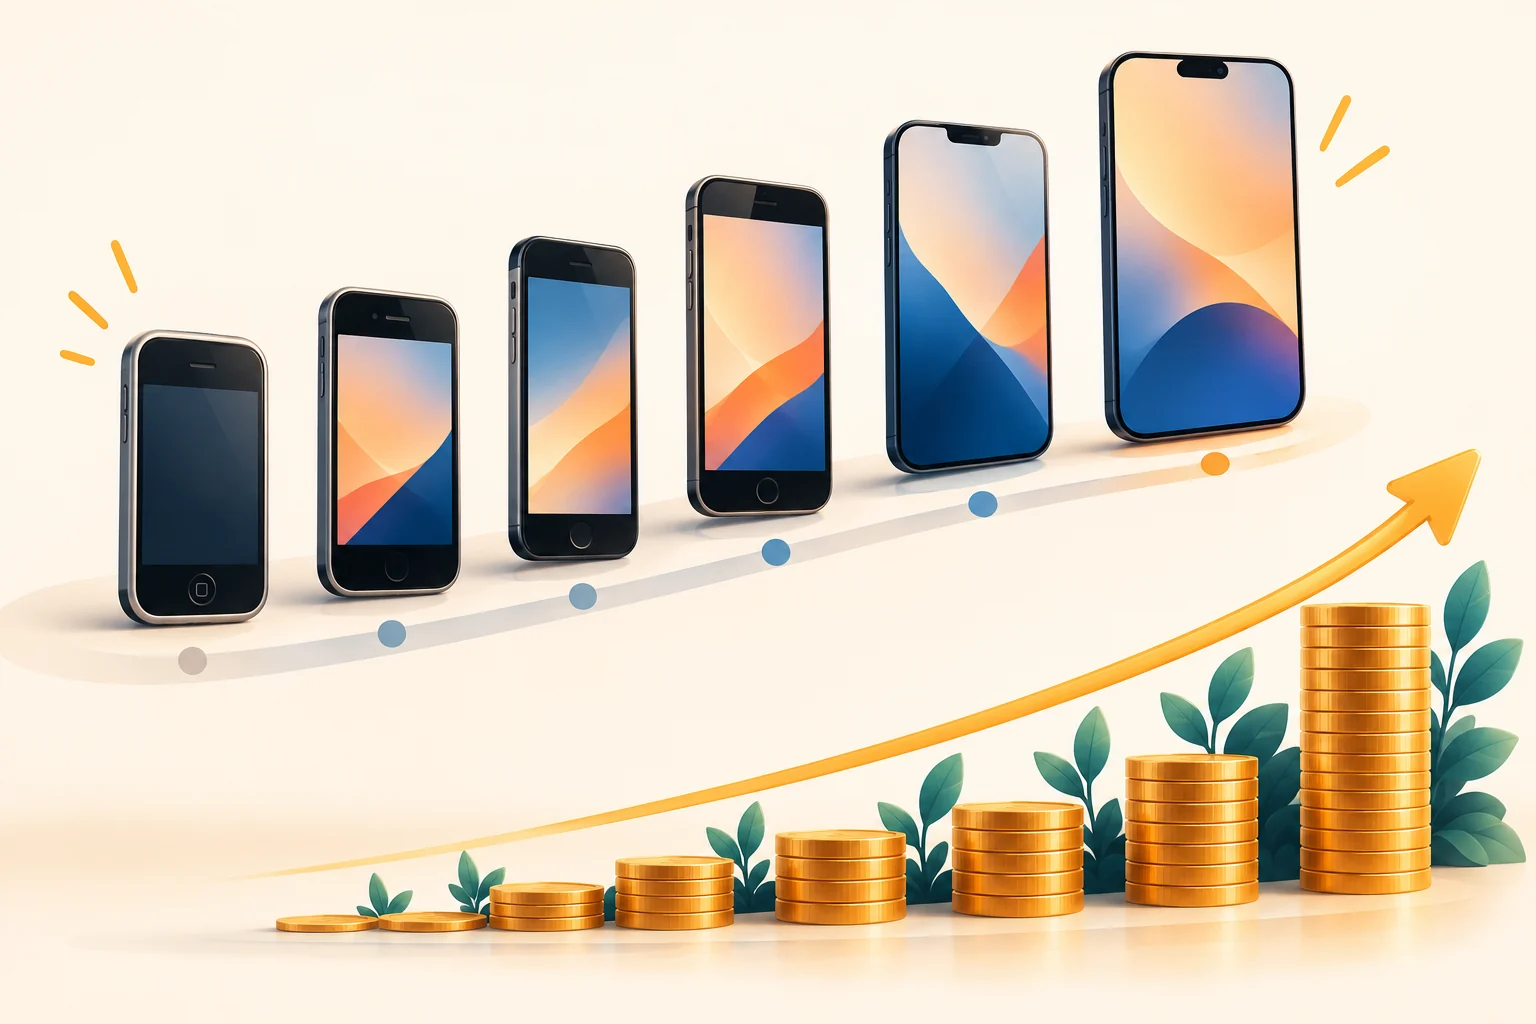
The result is the kind of number that makes you check the maths
Those nineteen $799 contributions add up to $15,181. At Apple's 19 October 2026 closing price of $342.94, the hypothetical portfolio comes to about $342,000. That's roughly $326,600 more than the money you put in.
Before you retire on the strength of that sentence, two important details: this is a historical what-if, not a forecast, and $799 is the same imaginary phone budget every year, not a claim that every iPhone cost $799.
In fact, the original iPhone launched in the United States at $499 for the 4GB model, while the base iPhone 17 launched at $799 in 2025. The prices in between were messy: some famous early launch prices came with carrier contracts. Our fixed-budget approach is a cleaner comparison, not a reconstruction of anyone's phone receipts. [Sources: Apple 2007, Apple 2025, 2008 contract pricing.]
Why the early purchases did so much of the work
Money invested early had more time in the market. It also had the chance to buy Apple shares when their adjusted prices were much lower.
Look at the first $799 invested at the end of 2007. Using the same historical price method, that contribution alone would be worth about $46,300 at the comparison date. The end-of-2008 contribution would be worth about $107,500. That's not a typo; 2008 was a very different market, and Apple's later rise was extraordinary. [Source: Apple annual adjusted-price history.]
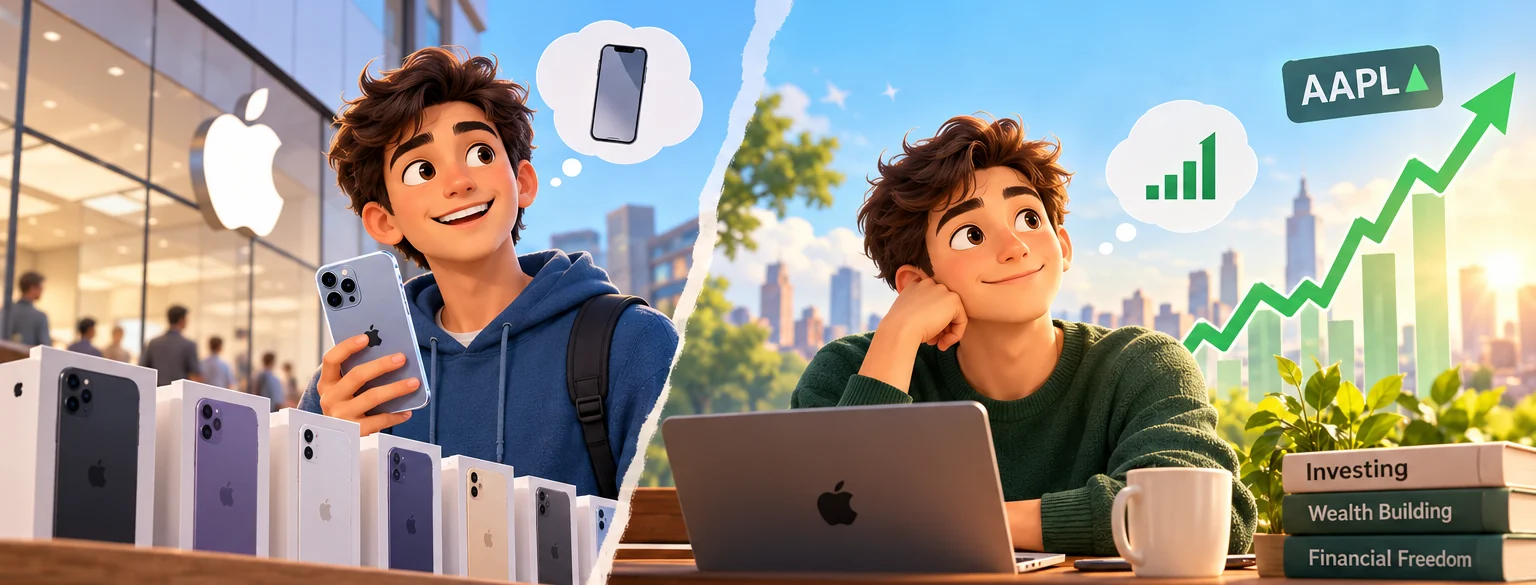
One important catch: the historical prices are adjusted for stock splits and dividends, which makes this a total-return-style illustration. The share counts in the example are adjusted investment units, not a record of how many original paper shares someone would have bought in 2007. We assume fractional investing and leave out tax, fees and inflation.
But who actually needs a brand-new phone every year?
Here's a more useful version of the challenge: buy a phone, keep it, and invest the budget you don't spend on replacements.
Start with a $799 phone in 2007. Replace it every three years: 2010, 2013, 2016, 2019, 2022 and 2025. That's seven phones across nineteen budget years. Invest the $799 in each of the twelve years you skipped an upgrade.
The result? You would have spent $5,593 on new phones, put $9,588 into Apple stock, and your hypothetical stock investment would be worth about $234,000 by 19 October 2026.
That is an unusually dramatic outcome because of Apple's particular history. But the everyday idea is much smaller and more portable: an upgrade you can happily skip gives you a choice about what to do with the money.

Keeping something longer also changes what it costs per day. A $799 phone used for three years costs roughly 73 cents a day, before resale value or repairs. Want to test a different phone price or lifespan? Try the CozyCalcs cost-per-use calculator.
Would investing instead of upgrading always win?
Definitely not. You can see Apple's winners clearly because we're looking backward. Plenty of companies never become Apple. A single stock can plunge, and the company you once admired may be very different ten years later.
There's also no magic in a phone sitting unopened in a drawer: the phone you actually use has value. It connects you to people, helps you work, takes pictures and might last for years. Our comparison doesn't price that usefulness, or account for trade-ins, second-hand sales, mobile plans, repairs, taxes or trading costs.
If you want a less company-specific thought experiment, the coffee-versus-investing calculator lets you test regular contributions using assumed annual returns, not Apple's historical record. The compound savings calculator explores the same habit from a saving-and-growth angle. Neither can promise a result.
How we calculated the Apple stock comparison
We used the last reported trading close of each calendar year from 2007 to 2025 and treated it as the date of a $799 investment. For each year, the contribution is divided by that year's split-and-dividend-adjusted close, then all adjusted units are valued at the 19 October 2026 close of $342.94.
In plain English: add up $799 ÷ each year's adjusted price, then multiply the total by $342.94. For the three-year-upgrade version, do this only for the years when you didn't buy a phone.
Prices are rounded to two decimals in our saved research snapshot, so the outputs are approximate. The comparison uses US dollars, not Australian dollars or a live currency conversion. It's also intentionally year-end, not an attempt to match individual iPhone launch dates. A future update should change the figures, date, and article together—not just the number on a chart. [Sources: StatMuse annual price table, 19 October 2026 stock close, Apple's split history.]
The better question to ask before your next upgrade
Maybe your phone is slow, the battery barely lasts, or it helps you do work you couldn't do before. Upgrade if the value is there. But if it still does everything you need, waiting one more year can be a surprisingly satisfying choice.
The real lesson of this Apple experiment isn't you should have bought Apple. Nobody handed out the future in 2007. It's that a recurring purchase and a recurring investment can lead to remarkably different stories.
Next time a shiny upgrade lands, try one question: Would I enjoy this more than keeping the phone I have and giving the money another job?
Quick questions
How much would Apple stock be worth if I'd invested the price of every iPhone?
In our example, investing $799 at each year-end from 2007 to 2025 totals $15,181. Valued on 19 October 2026, it would be worth about $342,000. That's a fixed-budget historical scenario, not a calculation of real iPhone retail prices.
Does this include Apple stock splits and dividends?
The historical prices are adjusted for splits and dividends, so this is a total-return-style approximation. We do not separately add dividends. Real investing results can differ because of trade dates, broker fees, taxes and whether dividends were reinvested.
What if I only upgraded my phone every three years?
Buying a $799 phone every third year from 2007 through 2025 means buying seven phones and investing the budgets from twelve skipped upgrades. In the same backtest, that stock investment would be worth about $234,000 on 19 October 2026. The phone purchases themselves are not part of the stock value.
Is buying Apple stock better than buying an iPhone today?
There's no universal answer. A phone is something you use; a share is an investment with risk. Apple could underperform in the future, and the phone might be essential for your work or daily life. This experiment illustrates the opportunity cost of upgrades—not a recommendation to buy any stock.
Historical illustration only. Not personalised investment advice. Figures are nominal US dollars, before inflation, tax and fees; returns aren't guaranteed. CozyCalcs is not affiliated with Apple.